
Gd(III) ion-chelated supramolecular assemblies composed of PGMA-based polycations for effective biomedical applications
Authors
- Yu Zhao
- Shun Duan
- Bingran Yu
- Fu-Sheng Liu
- Gang Cheng
- Fu-Jian Xu
Table of Contents
- Abstract
- Introduction
- Experimental Procedure Materials
- Synthesis Of The Pged-Cd-Gd Backbone
- Synthesis Of Ad-Pgea
- Preparation Of Supramolecular Assembly/Pdna Complexes
- Physicochemical Characterization
- Cell Viability Assay
- In Vitro Transfection Assay
- In Vitro Cellular Uptake
- In Vitro Mri
- Statistical Analysis
-
Results And Discussion
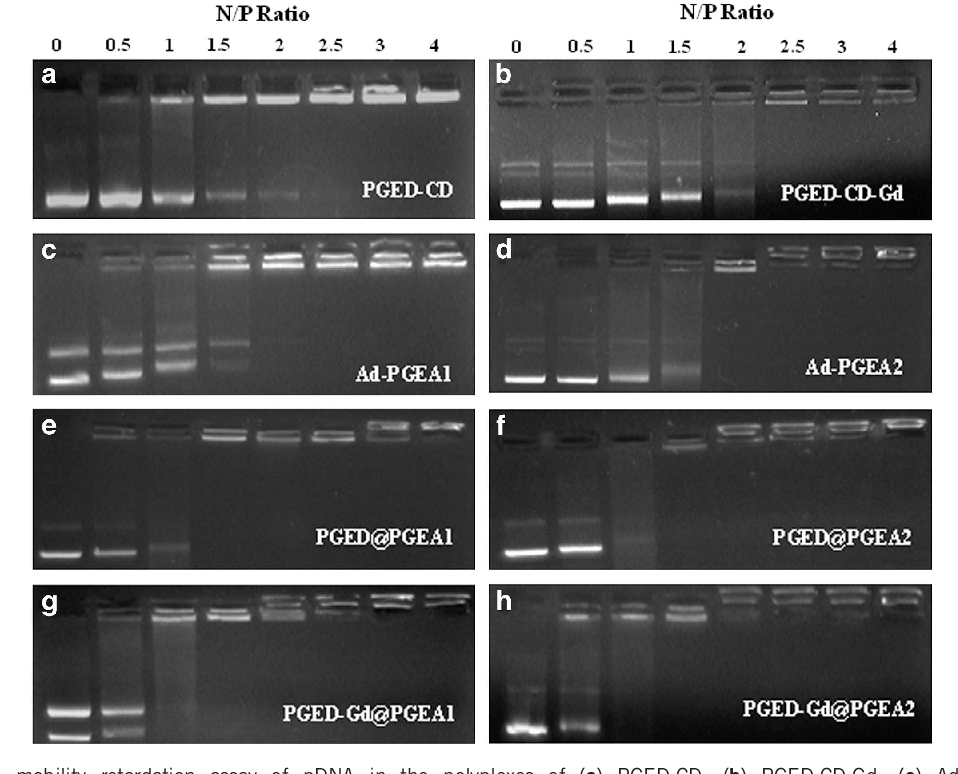
- Figure 1 Electrophoretic mobility retardation assay of pDNA in the polyplexes of (a) PGED-CD, (b) PGED-CD-Gd, (c) Ad-PGEA1, (d) Ad-PGEA2, (e) PGED@PGEA1, (f) PGED@PGEA2, (g) PGED-Gd@PGEA1 and (h) PGED-Gd@PGEA2 at various N/P ratios.
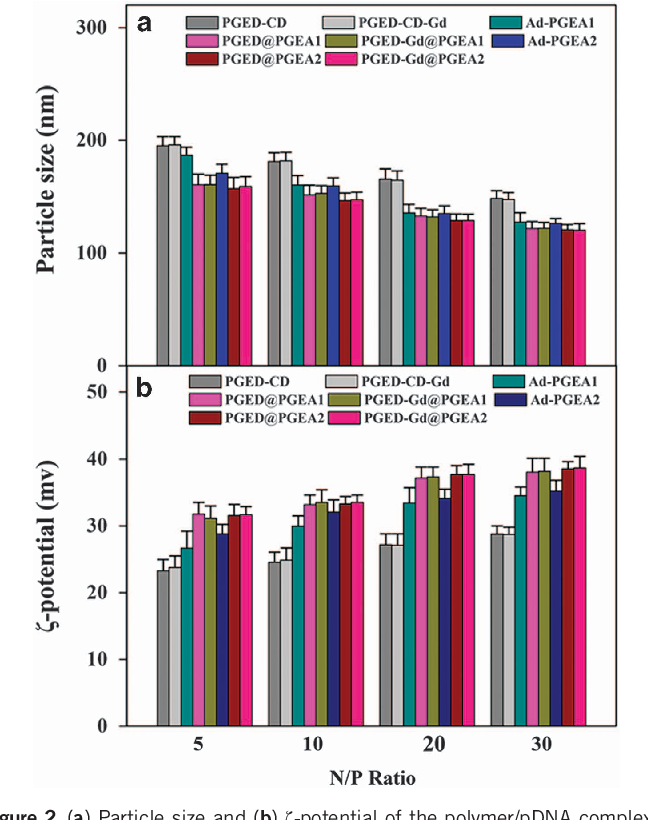
- Figure 2 (a) Particle size and (b) ζ-potential of the polymer/pDNA complexes at various N/P ratios.
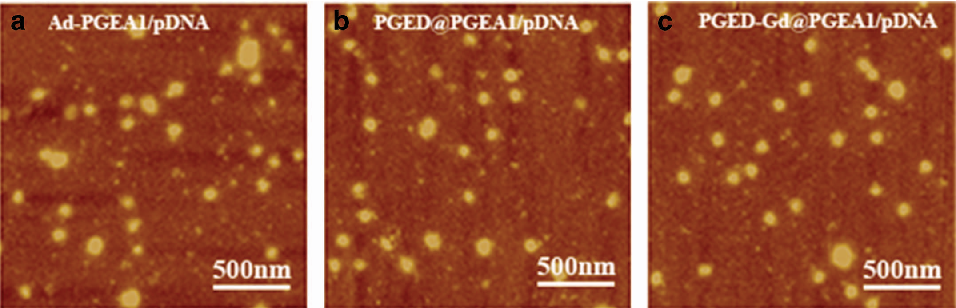
- Figure 3 AFM images of (a) Ad-PGEA1/pDNA, (b) PGED@PGEA1/pDNA and (c) PGED-Gd@PGEA1/pDNA complexes at the N/P ratio of 15.
- Gene Transfection Assay
- Biomedical Applications Of Polycations
- Cellular Internalization
- Conclusions
- References
Abstract
An intricate polymer complex can carry genes to their cellular targets with high efficiency and low toxicity. Gene therapy has the potential to revolutionize the treatment of diseases such as cancer, but non-viral gene delivery systems are needed to ensure patient safety. Fu-Jian Xu from the Beijing University of Chemical Technology and co-workers have taken steps to reach this goal by assembling cationic polymers and gadolinium (Gd) ions into spherical, supramolecular host-guest complexes. These compounds, based on biocompatible poly(glycidyl methacrylate) and cyclodextrin molecules, can be size adjusted to ensure the nanoparticles have the correct dimensions for optimal cellular uptake. The addition of Gd ions turns the multifunctional delivery device into a magnetic resonance imaging probe for in vivo monitoring of nucleic acid transfer.
Introduction
Gene therapy holds potential for treating many severe diseases, such as cancer and genetic diseases. 1 Successful gene therapy depends on highefficiency gene delivery processes, in which the gene carriers have an essential role. The application of traditional viral vectors has been a challenge because of their toxicity, immunogenicity and low capability for scaling up. 2 There has long been a scientific demand for developing non-viral gene delivery systems that can overcome the drawbacks of viral vectors. 3 Non-viral gene delivery has been advanced by the rapid development of materials science and technology. Numerous novel gene delivery systems have been proposed based on functional cationic polymers, such as polyethylenimine (PEI), [4] [5] [6] [7] [8] [9] poly(2-(dimethylamino) ethyl methacrylate), 4,10 poly(L-lysine), 11 poly(aspartic acid) 12, 13 and polyamidoamine. 14 However, these non-viral gene carriers still have shortcomings, including cytotoxicity, low transfection efficiency and lack of multifunction.
Recently, we found that ethanolamine (EA) or ethylenediamine (ED)-functionalized poly(glycidyl methacrylate) (PGMA), namely PGEA or PGED, could be used as effective gene carriers. 15, 16 They possess good gene transfection properties. To further improve the performance of PGMA-based gene carriers, several strategies have been applied such as polysaccharide introduction and target molecule binding. 16, 17 Owing to the dynamically unable ability of supramolecular polymers, the application of supramolecular chemistry for gene delivery has been a hot research topic in the biomedical field. 18, 19 The construction of supramolecular polycations via host-guest interaction is a popular strategy for high-efficiency gene delivery systems. 20 In particular, cyclodextrins (CDs) and their derivatives have been widely utilized for constructing supramolecular gene delivery systems, mainly because of their superior biocompatibility. [21] [22] [23] With the host-guest interaction strategy, we successfully prepared one PGEA-based supramolecular delivery system by tying multiple β-cyclodextrin (β-CD)cored star PGEA polymers to an adamantine-modified linear PGEA backbone. 24 Such PGEA supramolecules markedly increased transfection efficiencies. Further improvements in functionality and the development of new preparation strategies for PGMA-based supramolecular vectors would benefit the construction of better gene delivery systems.
To construct multifunctional supramolecular vectors, a novel strategy was proposed to flexibly prepare PGMA-based supramolecular delivery systems (PGED-Gd@PGEAs) with magnetic resonance imaging (MRI) functionality, by assembling multiple adamantine-headed star PGEA (Ad-PGEA) units with a versatile PGED-CD-Gd backbone (Scheme 1). This backbone possessed numerous flanking β-CD species and Gd 3+ ions. MRI technology has received considerable attention because of its high spatial resolution and its applications in areas such as deep tissue imaging. 25, 26 In particular, Gd 3+ ions have been used as contrast agents because of their optimal chemical and magnetic properties. 27, 28 In this work, Gd ions were chelated by diethylenetriaminepentacetate acid (DTPA) immobilized on the PGED backbones to introduce the MRI effect into the resultant PGED-Gd@PGEA supramolecular systems. The physicochemical properties of the PGED-Gd@PGEA assemblies, including plasmid DNA (pDNA) condensation ability, cytotoxicity, gene transfection, cellular uptake and MRI functionality, were examined in detail. The present work provides a new strategy to design multifunctional supramolecular delivery systems.
Experimental Procedure Materials
Branched PEI (Mw~25 kDa), β-CD (99%), epichlorohydrin (EP, 99%), 1-adamantanecarboxylic acid chloride (98%), pentaerythritol (98%), 2-bromoisobutyryl bromide (98%), ethyl bromoisobutyrate (99%), glycidyl methacrylate (GMA, 98%), N,N,N′,N″,N″-pentamethyldiethylenetriamine (99%), copper(I) bromide (99%), EA (98%), ED (98%), DTPA (98%), carbodiimide hydrochloride (98%), gadolinium(III) chloride hexahydrate (99%) and 3-(4,5-dimethylthiazol-2yl)-2,5-diphenyl tetrazolium bromide were bought from Sigma-Aldrich Chemical Co., St Louis, MO, USA. GMA was used after removal of the inhibitors. The plasmid pRL-CMV, encoding Renilla luciferase, (Promega Co., Cergy Pontoise, France), and the plasmid pEGFP-N1, encoding enhanced green fluorescent protein (EGFP) (BD Biosciences, San
Synthesis Of The Pged-Cd-Gd Backbone
Linear PGMA was prepared via atom transfer radical polymerization (ATRP). First, 160 μl of ethyl bromoisobutyrate (1 equiv), 2.1 ml of GMA (60 equiv) and 300 μl of N,N,N′,N″,N″-pentamethyldiethylenetriamine (2 equiv) were added to a 50 ml flask with 5 ml of dimethyl sulfoxide (DMSO). The reaction system was degassed with argon for 10 min before adding 115 mg of copper(I) bromide (1 equiv). The details of the preparation of PGMA are described in our earlier work. 29 The molar weight of PGMA was 4.6 × 10 3 g mol −1 polydispersity index (PDI) = 1.28. The resultant ED-functionalized PGMA (PGED) was prepared using excess ED, as reported previously. 16 As shown in Scheme 1, before the preparation of CD units containing PGED (PGED-CD), it was necessary to synthesize EP-modified CD (CD-EP), using similar procedures to those reported previously. 30 In brief, 1.5 g of β-CD was added to a 50 ml round flask with a mixture (v/v, 5/5 ml) of DMSO/i-PrOH. After the β-CD was thoroughly dissolved, 12.5 ml of 1 M NaOH aqueous solution was then added to the solution, followed by the addition of 2 ml of EP. The reaction proceeded at room temperature in a nitrogen atmosphere for 48 h. The pH of the reaction solution was adjusted to~7.0 with concentrated HCl. Excess acetone was used to precipitate the reaction mixture. The raw CD-EP was dissolved in a small amount of deionized (DI) water and dialyzed against DI water (4 × 5 l) with a dialysis membrane (MWCO, 1000 Da) at room temperature for 4 h, prior to lyophilization. PGED-CD was prepared subsequently. In a 50 ml flask, PGED (130 mg) and CD-EP (480 mg) were added with 7 ml of water. The molar ratio of the terminal amino groups (of PGED) and CD-EP units was 1.6:1. The reaction was conducted at 80°C for 48 h. The PGED-CD product was purified by a dialysis method and then lyophilized.
For the preparation of Gd 3+ -chelated PGED-CD (PGED-CD-Gd), the amidation reaction was used to introduce DTPA as the chelating agent of Gd 3+ ions onto PGED-CD according to procedures described previously. 31 In brief, 8 mg of carbodiimide hydrochloride and 40 mg of DTPA were dissolved in 7 ml of water. The molar ratio of carbodiimide hydrochloride and DTPA was kept at 1:5 to avoid cross-linking between the amino groups of PGED-CD and carboxylate groups of DTPA. The solution was stirred for 4 h at room temperature before adding 100 mg of PGED-CD. The molar ratio of the remaining amino groups (of PGED-CD) and DTPA units was 1:1. The reaction proceeded for 48 h to produce PGED-CD-DTPA. The resulting solution was purified by dialyzed with a dialysis membrane (MWCO, 1000 Da) against 0.1 M NaCl for 2 days and then dialyzed against DI water for 1 day. The purified solution of PGED-CD-DTPA was transferred into a flask, and GdCl 3 (GdCl 3 •6H 2 O) was added. The molar ratio of DTPA and GdCl 3 (GdCl 3 •6H 2 O) was kept at 1:1. The mixing solution was stirred for 24 h at room temperature and then dialyzed against DI water for 24 h. Subsequently, the PGED-CD-Gd product was lyophilized.
Synthesis Of Ad-Pgea
For the preparation of the Ad-PGEA guest, the adamantine-headed ATRP initiator (Ad-Br) with three initiation sites was first synthesized. Pentaerythritol (1.08 g, 7.94 mmol) was thoroughly dissolved in a 50 ml round flask containing 20 ml of anhydrous N,N-dimethylformamide. Then, 1-adamantanecarboxylic acid chloride (1 g, 5.05 mmol) and K 2 CO 3 (1.33 g, 9.64 mmol) were added. The reaction was conducted at 50°C for 24 h under magnetic stirring. The final reaction solution was centrifuged, evaporated and distillated under reduced pressure, producing Ad-OH with three hydroxyl groups. The resultant Ad-Br was prepared using the similar procedures described earlier. 29 Next, 447 mg of Ad-OH (1.5 mmol) was added to a 50 ml round flask containing 7 ml of N,Ndimethylformamide. Then, 0.75 ml of 2-bromoisobutyryl bromide (6 mmol) was dropped into the aforementioned solution under an ice bath condition and stirring for 24 h. The reaction mixture was quenched with water and extracted with CH 2 Cl 2 . The organic layer was washed with brine, dried over Na 2 SO 4 and concentrated under reduced pressure. The Ad-Br product was a yellowish syrupy-like liquid.
The resultant Ad-PGMA polymers were synthesized under the typical conditions of ATRP. 29 In a 50 ml flask, 120 mg of Ad-Br (1 equiv), 2.3 ml of GMA (100 equiv) and 70 μl of N,N,N′,N″,N″-pentamethyldiethylenetriamine (2.5 equiv) were added to a 50 ml round flask containing 5 ml of DMSO. The reaction system was degassed by nitrogen for 10 min before adding 22.8 mg copper(I) bromide (1 equiv) under a nitrogen atmosphere. The products with a polymerization time of 20 and 35 min were named Ad-PGMA1 (Mn = 5.5 × 10 3 g mol −1 , PDI = 1.26) and Ad-PGMA2 (Mn = 1.0 × 10 4 g mol −1 , PDI = 1.32), respectively.
The resulting EA-functionalized Ad-PGMA (Ad-PGEA) was prepared using excess EA as reported earlier. 15 The crude product was purified using a dialysis membrane (MWCO 3500), followed by lyophilization.
Preparation Of Supramolecular Assembly/Pdna Complexes
For the preparation of PGED@PGEA and PGED-Gd@PGEA assemblies, with a 1:1 molar feed ratio of the CD/Ad units, PGED-CD or PGED-CD-Gd was assembled with Ad-PGEA. The concentration of Ad-PGEA was based on the nitrogen concentration of 20 mM. Before use, equal volumes of Ad-PGEA solution and PGED-CD or PGED-CD-Gd solution were mixed, shaken and incubated at ambient temperature for 3 h. The final nitrogen concentration for all polymer solutions was 10 mM in DI water. The polymer to DNA ratio was expressed as the molar ratio of nitrogen (N) in PGMA-based polycations to phosphate (P) in DNA, named as the N/P ratio. The average mass weight per phosphate group of DNA was assumed to be 325. 32 All PGED@PGEA/pDNA and PGED-Gd@PGEA/pDNA polyplexes at different N/P ratios were formed by mixing polymer solution and pDNA solution for 30 min before use.
Physicochemical Characterization
1 H NMR spectra were measured on a Bruker ARX 400 MHz spectrometer using CDCl 3 (for Ad-Br and Ad-PGMA) and D 2 O (for Ad-PGEA, PGED, CD-EP, PGED-CD, PGED-CD-DTPA) as the solvents with tetramethylsilane (Me 4 Si) as an internal standard. GPC measurements of PGMA and Ad-PGMA were performed on a Waters GPC system, in which DMSO was used as the eluent at a low flow rate of 1.0 ml min −1 at 25°C and monodispersed poly (methyl methacrylate) standards were used to generate the calibration curve. Dynamic light scattering measurements of polyplexes were performed with a Zetasizer Nano ZS (Malvern Instruments, Southborough, MA, USA) equipped with a laser of wavelength 633 nm at a 173°scattering angle. Atomic force microscopy (AFM) studies were carried out with the Dimension Icon model with a Nanoscope IIIa controller (Bruker, Santa Barbara, CA, USA). The samples were imaged using the ScanAsyst mode. Image analysis was performed using Nanoscope software after removing the background slope after flattening the images. Gel electrophoresis was implemented in a Sub-Cell system (Bio-Rad Laboratories), and then, a UV transilluminator and BioDco-It imaging system (UVP Inc.) was used to record DNA bands.
Cell Viability Assay
C6 and Hep G2 cell lines from two common cancers were selected to evaluate the performance of the gene carriers. An 3-(4,5-dimethylthiazol-2yl)-2,5diphenyl tetrazolium bromide assay was used to evaluate the cytotoxicity of polyplexes at a series of N/P ratios in C6 and Hep G2 cells cultured in DMEM (with 10% fetal bovine serum) according to the methods described in our previous studies. 32, 33 In brief, the C6 and Hep G2 cells were cultured in 96-well plates at a density of 2 × 10 4 cells per well with DMEM (with 10% fetal bovine serum). Then, the culture medium was replaced with 100 μl of fresh culture medium. The PGEA-based and PEI complexes (6.7 μl per well containing 0.33 μg of pDNA) at various N/P ratios were added to the media. Then, the cells were incubated for 4 h, and fresh media were added to the culture for another 20 h. Then, 10 μl of sterile, filtered 3-(4,5-dimethylthiazol-2yl)-2,5diphenyl tetrazolium bromide solution in phosphate-buffered saline (PBS) (5 mg ml −1 ) was added to each well. After 4 h, the unreacted dye was removed, and the produced formazan crystals were dissolved in DMSO (100 μl per well). The OD values were measured at a wavelength of 570 nm with a Bio-Rad Model 680 Microplate Reader (UK). For each sample, the final absorbance was the average of those measured from six wells in parallel. The cell viability results were expressed as the percentage relative to that of the control.
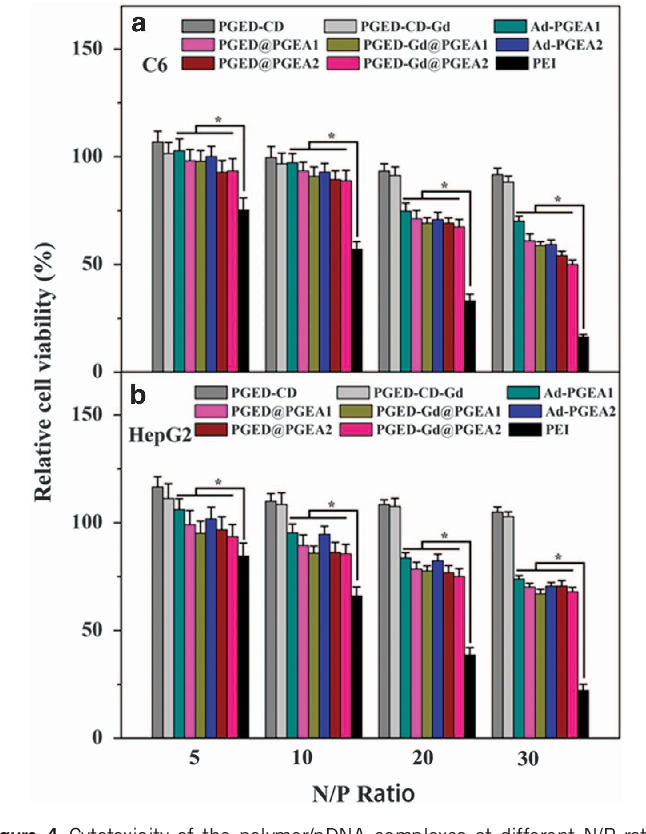
Low cytotoxicity is essential for ideal biomedical materials. To evaluate the cytotoxicity of PGMA-based polycation/pDNA complexes at different N/P ratios, an 3-(4,5-dimethylthiazol-2yl)-2,5-diphenyl tetrazolium bromide assay was performed using the C6 and Hep G2 cell lines. The relative cell viabilities of all of the groups in both cell lines decreased with increasing N/P ratios (Figure 4 ). The cytotoxicity of polycations generally increases with their molecular weight. 38 In comparison with the PGED-CD and PGED-CD-Gd backbone, PGED@PGEA and PGED-Gd@PGEA exhibited increased cytotoxicity. However, PGED@PGEA and PGED-Gd@PGEA showed significantly lower cytotoxicity than the gold standard, PEI (25 kDa). For example, at an N/P ratio of 30, for the PGMA-based polycation/pDNA complexes, the relative cell viability values of C6 cells were 450% and those of Hep G2 470%. In our earlier work, 3, 15, 24, 39, 40 it was found that in comparison with PEI, which mainly has secondary amine groups, the nonionic hydrophilic hydroxyl groups of PGEAs can shield the deleterious, excess charges of the cationic complexes, leading to lower cytotoxicity. In addition, no significant differences among the cytotoxicities of Ad-PGEA, PGED@PGEA and PGED-Gd@PGEA were observed. The above results indicated that the supramolecular polymers could achieve a lower cytotoxicity despite their high molecular weights.
In Vitro Transfection Assay
The plasmid pRL-CMV as the reporter gene was first utilized to estimate the in vitro gene transfection of PGMA-based polycation/pDNA polyplexes in C6 and Hep G2 cell lines. Essentially, the C6 and Hep G2 cells were cultured in 24well plates at a density of 6 × 10 4 cells per well with DMEM media (with 10% fetal bovine serum). Then, the solutions of polycation/pDNA complexes with different N/P ratios (20 μl per well with 1.0 μg of pDNA) were added into the transfection media. The detailed transfection procedures are described in our earlier work. 15, 16, 32, 33 A commercial Promega kit and a luminometer (Berthold Lumat LB 9507, Berthold Technologies GmbH KG, Bad Wildbad, Germany) were used to quantify the luciferase gene expression. Gene expression results were expressed as relative light units per milligram of cell protein lysate (relative light units per mg protein). The plasmid pEGFP-N1 with EGFP gene was also utilized as the reporter gene in C6 and Hep G2 cell lines at the optimal N/P ratio of the polycations to evaluate polymer-mediated gene transfection. The transfected cells were imaged with a Leica DMI3000B fluorescence microscope. The percentage of the EGFP-positive cells was determined by flow cytometry (Beckman Coulter, Brea, CA, USA).
In Vitro Cellular Uptake
The in vitro cellular uptake was determined by flow cytometry analysis and imaged using fluorescence microscopy. C6 and Hep G2 cells were seeded into 24-well plates at the density of 8 × 10 5 cells per well and incubated for 24 h. Then, the cells were incubated with the fresh media containing PGMA-based polycation/pDNA polyplexes for 4 h, where pDNA (pRL-CMV) were labeled with the fluorescent dye YOYO-1. 34 The cells were trypsinized, centrifuged, resuspended in PBS and then analyzed by flow cytometry (BD LSR II, BD, USA). For the fluorescence imaging, after cellular uptake, the cells were washed with PBS five times and stained with 4′,6-diamidino-2-phenylindole for 10 min. The fluorescence images were acquired on a Leica DMI3000B microscope.
In Vitro Mri
Approximately 5 × 10 6 C6 or Hep G2 cells were seeded and incubated in cell culture flasks for 24 h. Then, the media were replaced with 5 ml of fresh media containing PGED-CD-Gd or PGED-Gd@PGEA ((Gd) = 0, 5, 10 and 20 μM, respectively). After incubation at 37°C for 4 h, the cells were washed with PBS three times and then precipitated by centrifugation. The MRI experiments were performed on a 7.0-T MRI instrument (BioSpec 70/20 USR 7.0 T Bruker) with a wrist receiver coil. The pulse sequence was a T1 map-RATE sequence with the following parameters: TR/TE = 400, 800, 1500, 2500, 4000/7 ms: field of view: 3.5 cm 2 ; matrix: 128 × 128; number of excitations: 1; slice thickness = 1 mm; slice gap = 0 mm; field of view: 3.5 cm. PGED-Gd@PGEA or detached cells were prepared in PBS at different concentrations in 0.5 ml Eppendorf tubes. The T1 relaxivities were determined via a linear fit of the inverse relaxation time as a function of the Gd 3+ concentration.
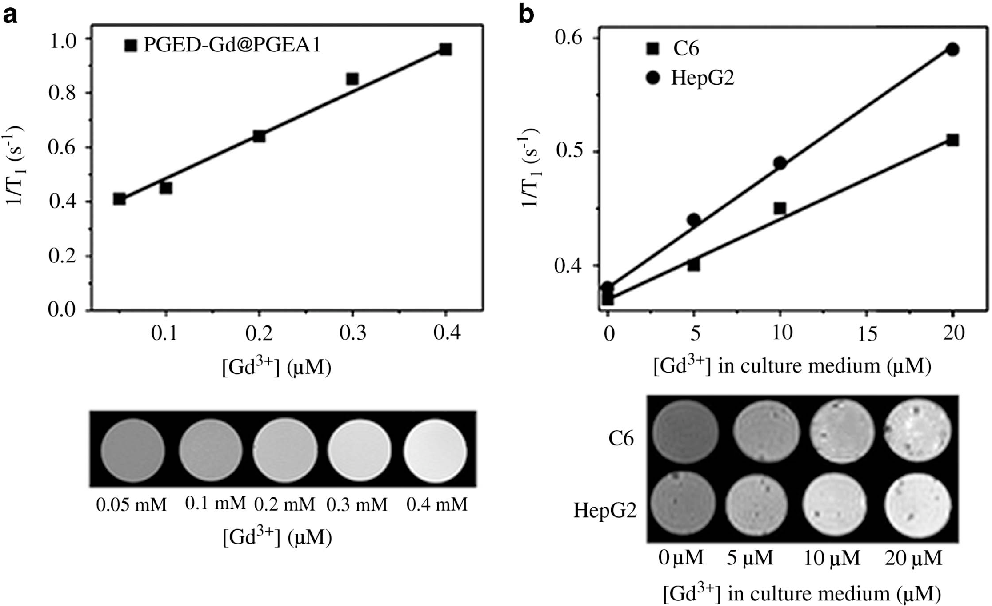
The complexes with gadolinium have been widely used as efficient T1weighted MR contrast agents. 41, 43 PGED-Gd@PGEA was expected to act as an MRI contrast agent (relaxation times were shown in Supplementary Table S1 ). The MRI assay of PGED-Gd@PGEA1 is shown in Figure 8 . A linear curve could be obtained by plotting the inverse T1 as a function of the molar concentration of Gd 3+ ions (Figure 8a, top) . The brightness of the MR images increased with the molar concentration of Gd 3+ ions (Figure 8a, bottom) . Next, the potential to use the PGED-Gd@PGEA1 for MRI of cancer cells was explored. Both C6 and Hep G2 cells were treated for 4 h with PGED-CD-Gd and PGED-Gd@PGEA1 at different Gd 3+ ion concentrations in culture media (0, 5, 10 and 20 μM,) before imaging with the MR systems. Both the inverse T1 and MR images were presented and collected. The MR images of cancer cells treated with PGED-CD-Gd became slightly brighter with an increasing concentration of Gd 3+ ions (Supplementary Figure S7) . However, the MR images of cancer cells treated with PGED-Gd@PGEA1 evidently became brighter, and the inverse T1 increased with the concentration of Gd 3+ ions (Figure 8b ), likely arising from the higher cellular uptake of PGED-Gd@PGEA1 (Figure 7) . The above results indicated that supramolecular structure could also affect the relaxation time in vitro. PGED-Gd@PGEA could potentially be used as a contrast agent for MR imaging.
Statistical Analysis
All experiments were repeated at least three times. The data are presented as means ± s.d. Statistical significance (Po0.05) was evaluated by a t-test when two groups of samples were compared, and the statistical significance was set at Po0.05.
Results And Discussion
Preparation and characterization of supramolecular polycations with Gd 3+ chelation As shown in Scheme 1, the PGMA-based supramolecular delivery systems (PGED-Gd@PGEAs) with MRI functions were prepared by assembling multiple Ad-PGEA units with a PGED-CD-Gd backbone. The PGED-CD-Gd backbone possessed numerous flanking β-CD species and Gd 3+ ions. For the preparation of the PGED-CD-Gd backbone, the starting PGMA (Mn = 4.6 × 10 3 g mol −1 , PDI= 1.28) with 32 repeat units was first synthesized via ATRP. Then, PGMA was functionalized with excess ED by ring-opening addition to produce PGED with abundant primary amine groups. Similar to our previous study, 16 it was confirmed that the PGED was successfully prepared from the NMR results ( Supplementary Figure S1(a1) ). To introduce β-CD units, CD-EP that possessed one epoxy ring (Supplementary Figure S1(a2) ) was immobilized onto PGED via ring-opening Figure S1(a3) ), the molar ratio of β-CD and ED units was 1:2, indicating that every PGED-CD chain contained 16 β-CD units. DTPA, the chelating agent of Gd 3+ ions, was subsequently reacted with the remaining primary amine groups of PGED-CD via the amidation reaction, producing PGED-CD-DTPA. Based on the 1 H NMR spectrum of PGED-CD-DTPA ( Supplementary Figure S1(a4) ), PGED-CD-DTPA contained~12 DPTA units. The resultant PGED-CD-Gd backbone was obtained by the chelation of PGED-CD-DTPA with Gd 3+ ions. According to the thermogravimetric analysis (Supplementary Figure S2) , the PGED-CD-Gd backbone contained~10 Gd 3+ ions, which was fairly consistent with the number of DPTA units.
The synthesis of the Ad-PGEA guest with three arms was performed in a four-step procedure (Scheme 1). C(CH 2 OH) 4 was compounded with 1-adamantanecarboxylic acid chloride, and the rest of the hydroxyl groups were reacted with 2-bromoisobutyryl bromide to initiate the ATRP process of GMA, followed by ring-opening of epoxy groups of Ad-PGMA with excess EA. Every step of the preparation process of Ad-PGEA was monitored by 1 H NMR (Supplementary Figure S3 ). After the first two steps of the substitution reaction, C-CH 2 -OCO protons and CH 3 -C-Br protons from the newly formed Ad-OH and Ad-Br were observed at~3.89 and 1.95 ppm, respectively. By integrating the corresponding NMR peaks, it was estimated that Ad-Br possessed approximately three initiation sites. The resultant Ad-PGMA1 (Mn = 5.5 × 10 3 g mol −1 , PDI= 1.26) and Ad-PGMA2 (Mn = 1.0 × 10 4 g mol −1 , PDI = 1.32) were prepared by using Ad-Br. The Ad-PGMA species were further functionalized with excess EA to produce the corresponding Ad-PGEA1 and Ad-PGEA2 guests with different molecular weights. Similar to our previous studies, 15, 16 Ad-PGMA and Ad-PGEA were successfully prepared, as shown by the NMR results (Supplementary Figure S3 ). For the preparation of the PGED@PGEA and PGED-Gd@PGEA assemblies, two Ad-PGEA guests were complexed with PGED-CD or PGED-CD-Gd hosts in DI water by the host-guest interaction of Ad and CD species.
Characterization of polymer/pDNA nanocomplexes For non-viral polycationic gene carriers, the ability to condense pDNA into a nanoparticle is essential because nanocomplexes of carrier and pDNA are more suitable for cellular uptake. In this work, agarose gel electrophoresis, particle size and ζ-potential measurements, as well as AFM images, were used to confirm the ability of PGMA-based polycations to condense pDNA. The gel retardation results of polymer/pDNA complexes with increasing N/P ratios are shown in Figure 1 . All PGED@PGEA and PGED-Gd@PGEA could compact pDNA completely within the N/P ratio of 1.5, whereas the PGED-CD-Gd backbone and Ad-PGEA guests only condensed pDNA when N/P ratios reached 2.5. The above results indicated that the pDNAcondensing ability of PGED@PGEA and PGED-Gd@PGEA is better than that of PGED-CD-Gd and Ad-PGEA, which is probably because of the high molecular weight supramolecular structures. 35 The particle size and the ζ-potential of polymer/pDNA complexes with increasing N/P ratio are shown in Figure 2 . The particle sizes of all complexes decreased with increasing N/P ratios. At lower N/P ratios, loose aggregates with large size were formed owing to the few positive charges on the polymers. 36 With an increase in the N/P ratios, the diameters of all complexes decreased to 100-150 nm, which enabled the complexes to easily undergo endocytosis. It was also noted that at both low and high N/P ratios, the polycation/pDNA complexes had good stability (Supplementary Figure S4 ). In addition to particle sizes, the ζ-potential of polymer/pDNA complexes are another factor that affects cellular uptake. All of the complexes had positive ζ-potentials, and the values of the ζ-potential slightly increased with the N/P ratios. Owing to the positive charges, polymer/pDNA complexes had a good affinity for the negatively charged cell membrane and were able to facilitate cellular uptake. 37 The ζ-potential values of PGED@PGEA and PGED-Gd@PGEA groups were higher than those of the PGED-CD-Gd backbone and Ad-PGEA guests, once again confirming that PGMA-based supramolecular polycations possessed better DNA-compacting ability.
The morphology of polymer/pDNA complexes was observed by AFM. Figure 3 shows the representative AFM images of Ad-PGEA1/ pDNA, PGED@PGEA1/pDNA and PGED-Gd@PGEA1/pDNA complexes at the N/P ratio of 15. The AFM images show that the polymers could compact pDNA to form nanoparticles with a diameter of 100 nm, which is consistent with the results of particle size measurement (Figure 2a ).
Gene Transfection Assay
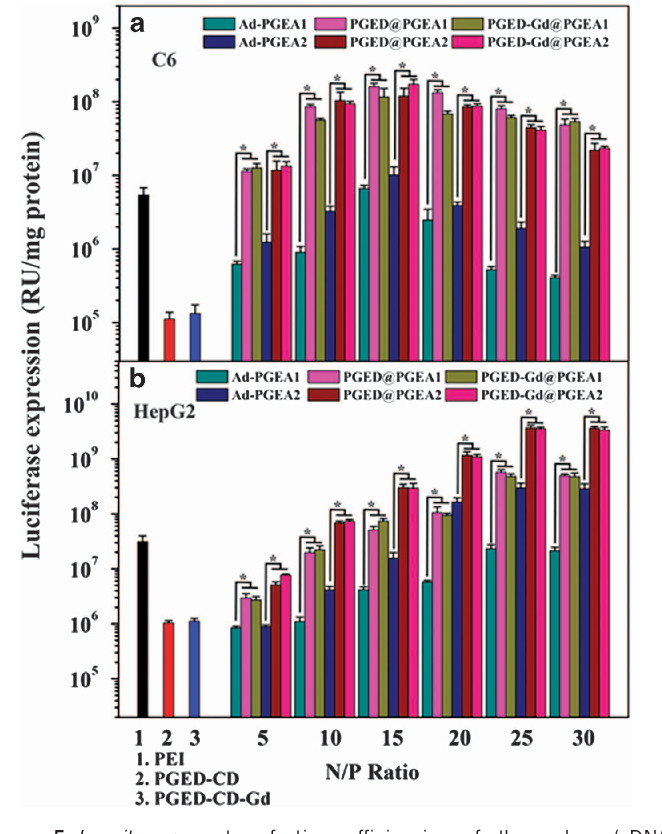
The gene transfection efficiency of the polycation/pDNA complexes was first analyzed in C6 and Hep G2 cell lines using pRL-CMV as a reporter gene. The C6 and Hep G2 cell lines are documented to be difficult to transfect with synthetic vectors. 41 Figure 5 shows the gene transfection efficiencies mediated by Ad-PGEA, PGED@PGEA and PGED-Gd@PGEA at various N/P ratios in comparison with those mediated by the controls (PEI (25 kDa), PGED-CD and PGED-CD-Gd) at their respective optimal N/P ratios. In general, the transfection efficiency first increases and then decreases slightly with increasing N/P ratio. At lower N/P ratios, cationic polymers cannot efficiently compact DNA, and the resultant loose nanocomplexes cannot easily enter cells. By contrast at higher N/P ratios, the transfection efficiency slightly decreased, probably as a result of the increased toxicity of free cationic polymers. The difference in gene transfection efficiencies at the same N/P ratio was observed between C6 and Hep G2 cells. The transfection efficiencies of gene carriers depend on different cell types because of their different properties. 42 As expected, the transfection efficiencies of PGED@PGEA and PGED-Gd@PGEA were significantly higher than those of Ad-PGEA guests at various N/P ratios because PGED@PGEA and
Biomedical Applications Of Polycations
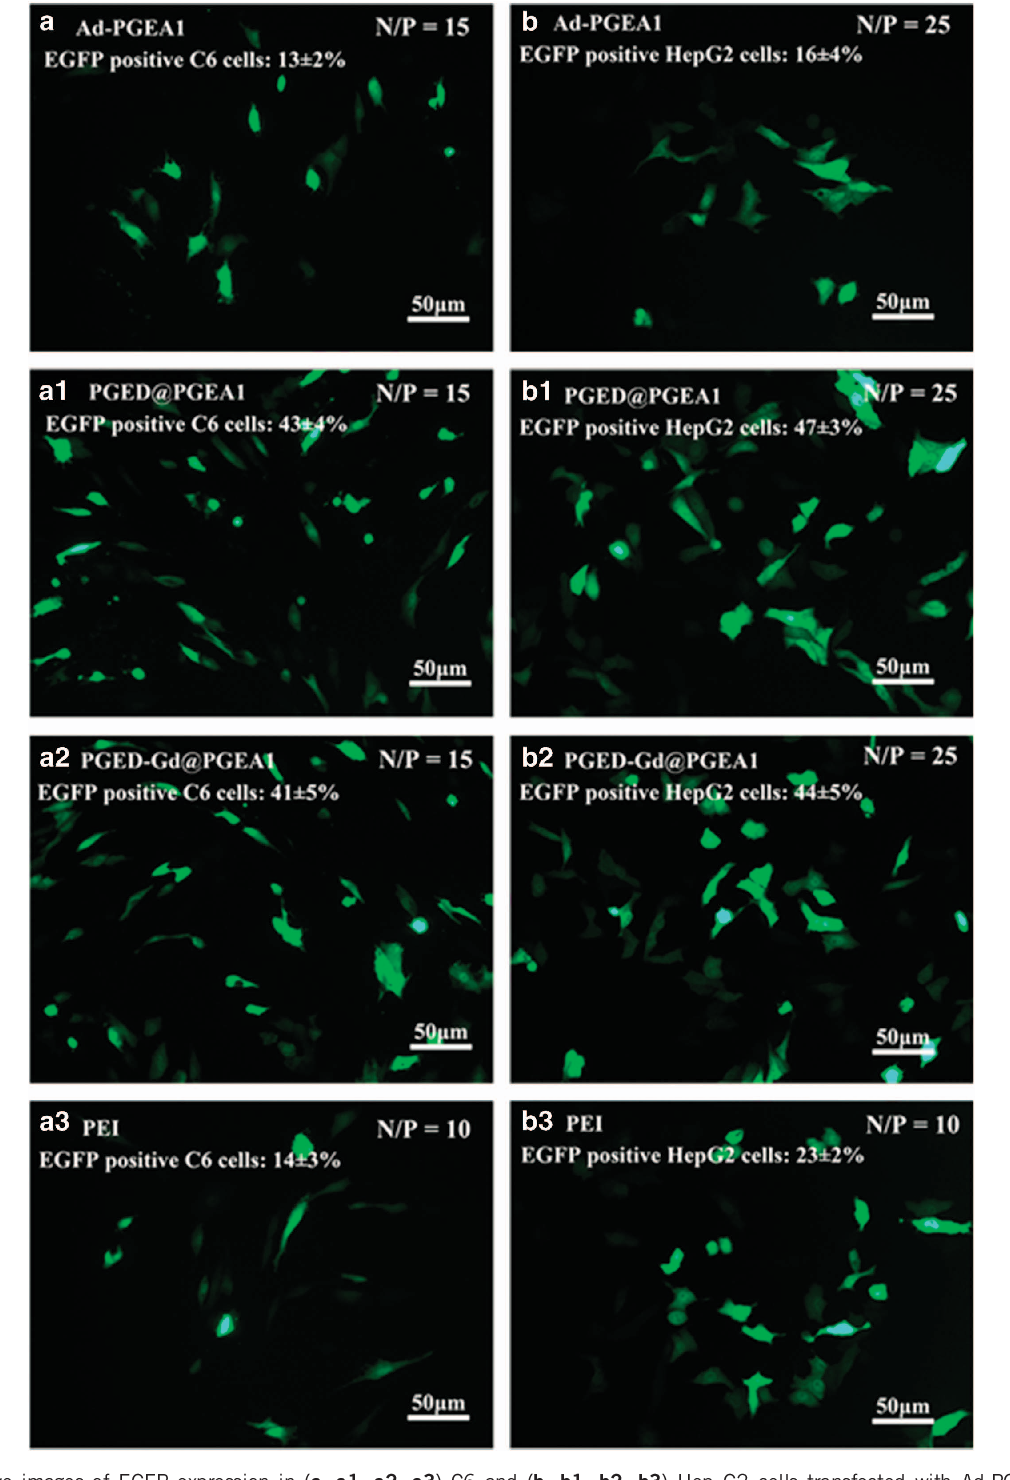
Y Zhao et al encoding GFP, was used as another reporter gene in C6 and Hep G2 cell lines. Representative images of EGFP gene expression mediated by Ad-PGEA1, PGED@PGEA1 and PGED-Gd@PGEA1 at their respective optimal N/P ratios are shown in Figure 6 . The corresponding merged images are shown in Supplementary Figure S5 . Transfection with PGED@PGEA1 or PGED-Gd@PGEA1 led to more green (EGFPpositive) Hep G2 cells than did Ad-PGEA1 or PEI. The transfection efficiency, as reflected by the percentage of EGFP-positive cells, was quantitatively determined using flow cytometry. The percentages of EGFP-positive cells for Ad-PGEA1, PGED@PGEA1, PGED-Gd@PGEA1 and PEI in C6 (or Hep G2) cells are 13% (or 16%), 43% (or 47%), 41% (or 44%) and 14% (or 23%), respectively, which is fairly consistent with the results for luciferase expression ( Figure 5 ). The above gene transfection assay indicated that the supramolecular structure improved the gene transfection, and Gd 3+ ions had no obvious adverse effects on the transfection process.
Cellular Internalization
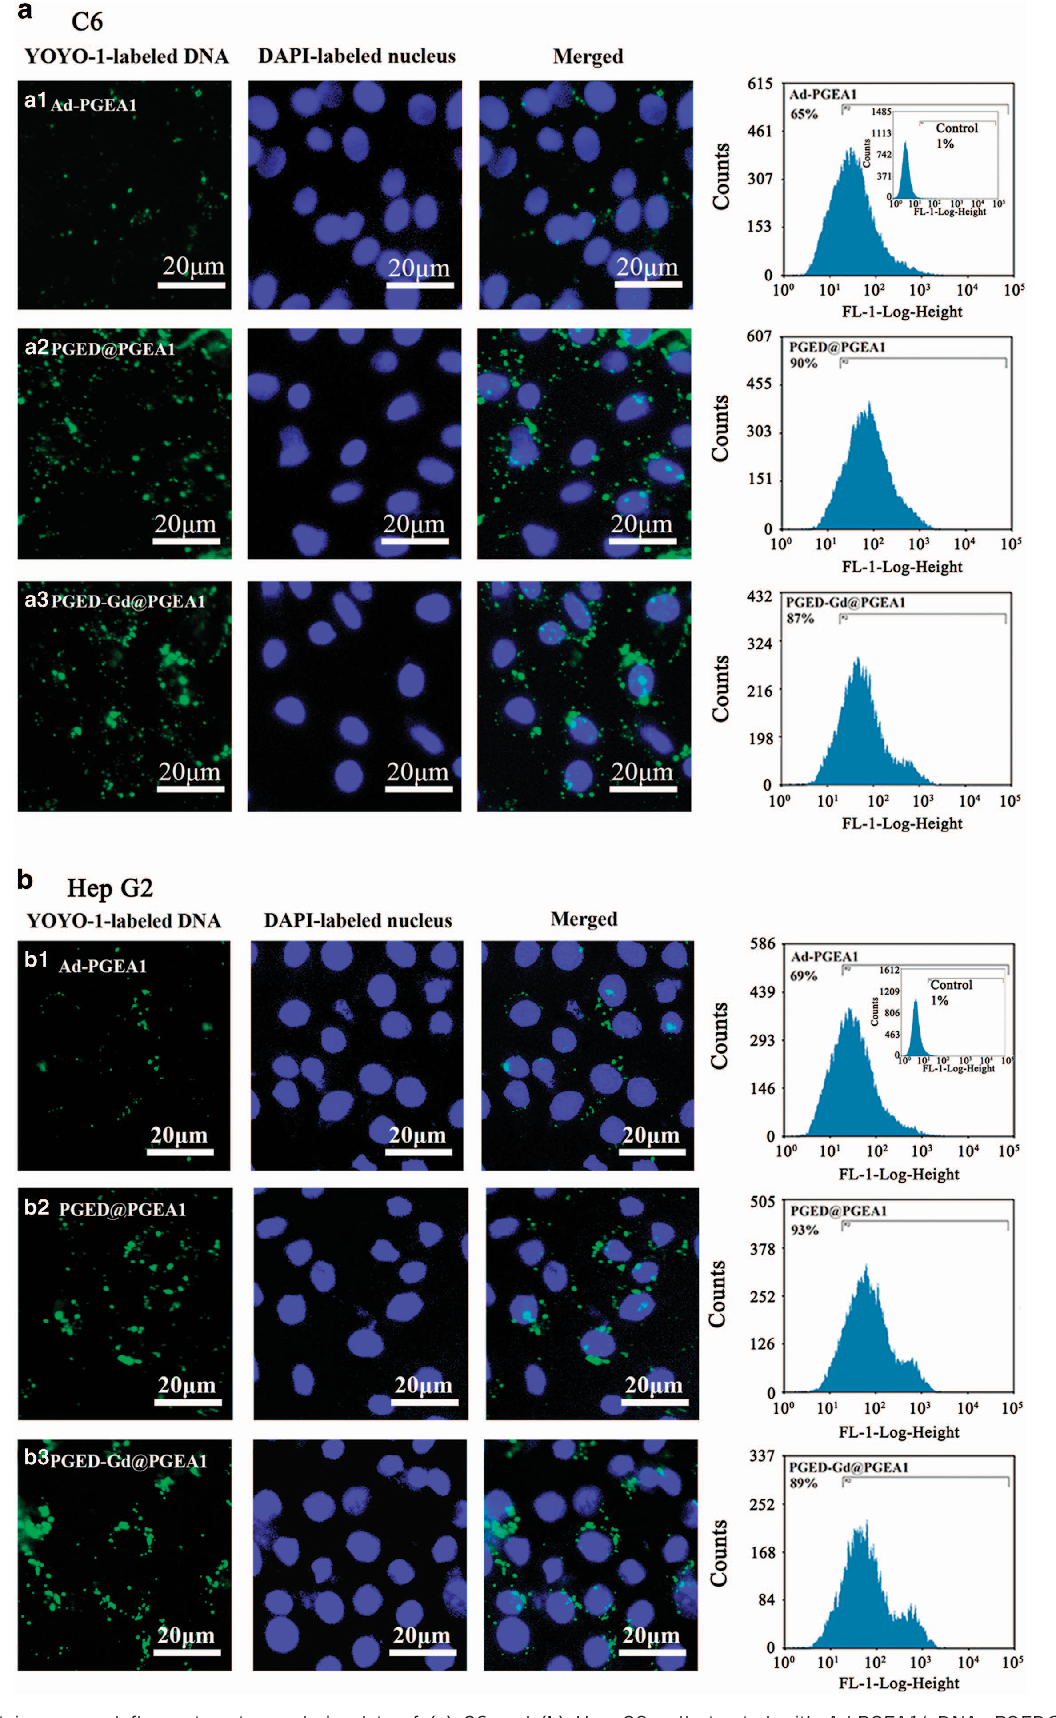
To investigate the intracellular fates of the supramolecular vectors, the C6 and Hep G2 cells were treated with the Ad-PGEA1/pDNA, PGED@PGEA1/pDNA and PGED-Gd@PGEA1/pDNA complexes for 4 h at their respective optimal N/P ratios (15 for C6 cells and 25 for Hep G2 cells), whereas the pDNA was labeled by YOYO1, as shown in Figure 7 . YOYO1-labeled pDNA is shown in green. The nuclei stained with 4′,6-diamidino-2-phenylindole are shown in blue. Compared with the cells treated with Ad-PGEA1/pDNA, the cells treated with PGED@PGEA1/pDNA and PGED-Gd@PGEA1/pDNA showed more green aggregations. The corresponding merged images are shown in Supplementary Figure S6 . The cellular uptake of the complexes with YOYO1-labeled pDNA was quantified by flow cytometry. The percentages of YOYO1-positive cells treated with PGED@PGEA1/ pDNA and PGED-Gd@PGEA1/pDNA were almost 90%, much higher than those (65~69%) of the cells treated with Ad-PGEA1/pDNA. This result was consistent with the fluorescent images of cellular uptake, confirming that supramolecular structure enhanced cell uptake, benefiting the resultant gene transfection.
Conclusions
A series of PGMA-based supramolecular polycations (PGED-Gd@PGEAs) with MRI functionality were successfully constructed by assembling multiple Ad-PGEA guests with a versatile PGED-CD-Gd host, which possessed numerous flanking Gd 3+ ions. Such PGED-Gd@PGEAs had good DNA condensation abilities and low cell cytotoxicity. Moreover, PGED-Gd@PGEAs exhibited significantly higher transfection efficiencies than PEI (25 kDa) and the constituent units (PGED-CD-Gd and Ad-PGEA). The chelation of Gd 3+ ions imparted PGED-Gd@PGEAs with effective MRI functionality without adverse effects on gene transfection processes. These unique features could allow PGED-Gd@PGEA to become a competitive multifunctional gene delivery system. Figure 8 Linear fitting of the inverse T 1 and the T 1 -weighted MR images of (a) PGED-Gd@PGEA1 solutions and (b) C6 and Hep G2 cells treated with PGED-Gd@PGEA1 at different Gd concentrations.