
Assessing the utility of social media as a data source for flood risk management using a real‐time modelling framework
Authors
- L. Smith
- Q. Liang
- P. James
- W. Lin
Table of Contents
- Abstract
- Introduction
- Recent Flooding In Tyne And Wear
- The Modelling Framework
- Social Media Harvesting And Analysis
-
Real-Time Flood Modelling
- Figure 4 Map showing the nine different models for Newcastle upon Tyne. Contains Ordnance Survey data © Crown copyright and database right 2013.
- Table 1
- Table 2 (not extracted)
- Figure 5 An example of the complex and dangerous hydrodynamics which can occur in urban flooding, showing water cascading at high speeds down steep steps in Newcastle upon Tyne.
- Flood Model Result Analysis
- Results And Discussion
- Geolocating Tweets And Identifying Criteria To Assess Models Against
-
Correlation Of Models Against Criteria From Social Media And Known Data
- Figure 10 Percentage of model criteria from social media satisfied by different total rainfall amounts for the August 5 event.
- Figure 11 Percentage of model criteria from social media satisfied by different total rainfall amounts for the June 28 event.
- Figure 12 Flood depth map for 45 mm of rainfall in the Heaton area of Newcastle upon Tyne, where circled areas correlate to areas known to have flooded from news reports and crowd-sourced photographs. Contains Ordnance Survey data © Crown copyright and database right 2013.
- Conclusions
- References
License
Abstract
The utility of social media for both collecting and disseminating information during natural disasters is increasingly recognised. The rapid nature of urban flooding from intense rainfall means accurate surveying of peak depths and flood extents is rarely achievable, hindering the validation of urban flood models. This paper presents a real-time modelling framework to identify areas likely to have flooded using data obtained only through social media. Graphics processing unit (GPU) accelerated hydrodynamic modelling is used to simulate flooding in a 48-km2 area of Newcastle upon Tyne, with results automatically compared against flooding identified through social media, allowing inundation to be inferred elsewhere in the city with increased detail and accuracy. Data from Twitter during two 2012 flood events are used to test the framework, with the inundation results indicative of good agreement against crowd-sourced and anecdotal data, even though the sample of successfully geocoded Tweets was relatively small.
Introduction
The UK was subjected to a series of intense storms throughout 2012, bringing severe flooding and damage totalling millions of pounds. In some cases, lives were lost. Such events are not unique to the UK, with a similar situation reported across Europe. The UK Environment Agency has invested heavily in a monitoring network for major rivers, which are used as data sources in real-time hydrodynamic models. Accurate real-time observations are essential for forecasting and nowcasting during incidents, and to provide validation data for model development. However, no formalised monitoring network presently exists for surface water flooding (i.e. pluvial), which tends to be short-lived and result from convective storms which are difficult to accurately forecast. Surface water flooding from intense rainfall poses a risk to a substantial number of properties, estimated at 2.8 million (Pitt, 2008; Environment Agency, 2009 ). At present, a system exists to issue alerts for potential extreme rainfall; however, there is a recognised need to extrapolate from these data the specific areas at risk of flooding, which are often highly localised, sometimes to the level of individual properties (Pitt, 2008; Golding, 2009) . Development of such warning systems is hampered by a lack of data and the varied nature of different rainfall events which might ultimately result in flooding.
Flood modelling at the city scale is rarely considered feasible. The complex nature of urban environments is problematic, characterised by gradients, narrow gaps between buildings, culverted watercourses, and drainage networks of varying quality and age. Steep slopes and narrow gaps can induce supercritical flow conditions, resulting in such phenomena as hydraulic jumps, and thus requiring shockcapturing but computationally intensive models if they are to be accurately reproduced (Mignot et al., 2006) . Allowing water to pass through the narrow gaps then requires high grid resolutions, typically 2 m or better (Schubert and Sanders, 2012) , demanding millions of grid cells. These two factors combined mean even for the relatively short duration events typical for summer storms (i.e. 2 h or less), model run-times are likely to be slower by an order of magnitude or more than real-time.
Improved data collection and real-time modelling of flood events allows emergency services and relevant authorities to make more-informed decisions about where they direct their attention. In some instances, the areas where explicit reports of flooding are received are not those requiring the most urgent attention. Dissemination of real-time flood extent data to the public allows them to make safer choices when selecting routes for travel. Retrospectively, flood extent data have applications in determining the best location for defences, drainage upgrades, and 'soft engineering' strategies (i.e. warning systems, sandbags, insurance, planning constraints).
Further development, validation, and implementation of viable and accurate surface water flood warning systems requires a step change in the volume of data collected during and after flood events, and in the efficiency and capabilities of hydrodynamic modelling frameworks. Clear evidence exists that social media is increasingly used as a tool for dissemination and communication during times of crisis and natural disasters, such as during the 2011 Queensland flood and Thai flood Vieweg et al., 2010; Kongthon et al., 2012; Murthy and Longwell, 2013) ; the accuracy and validity of information provided by the public through social media such as Twitter, however, may be questionable. A further complication is that only a small portion (approximately 1.5% but increasing) of Tweets are precisely geotagged (Crampton et al., 2013) , which is crucial information for locating and evaluating the extent of flooding. Comparison of locations geocoded from the text within Tweets against the actual location of the user from geotags suggests that even when Tweets are geotagged, these data can rarely be considered reliable for inferring flooded locations (Leetaru et al., 2013) . Clearly, an alternative approach is required.
This paper makes a contribution to both understanding the geographic components of Twitter data and integration thereof with real-time flood modelling. We contribute to ongoing discussions regarding the possibilities and challenges of actively engaging with the public through social media for hazard and risk management. The framework demonstrates that social media provides an excellent source of data, and that its utility may be further enhanced when coupled with efficient graphics processing unit (GPU) accelerated real-time high-resolution hydrodynamic modelling. Some limitations are also identified, insofar as capturing the spatial and temporal variations in rainfall intensity and correctly interpreting the meaning of social media messages.
Recent Flooding In Tyne And Wear
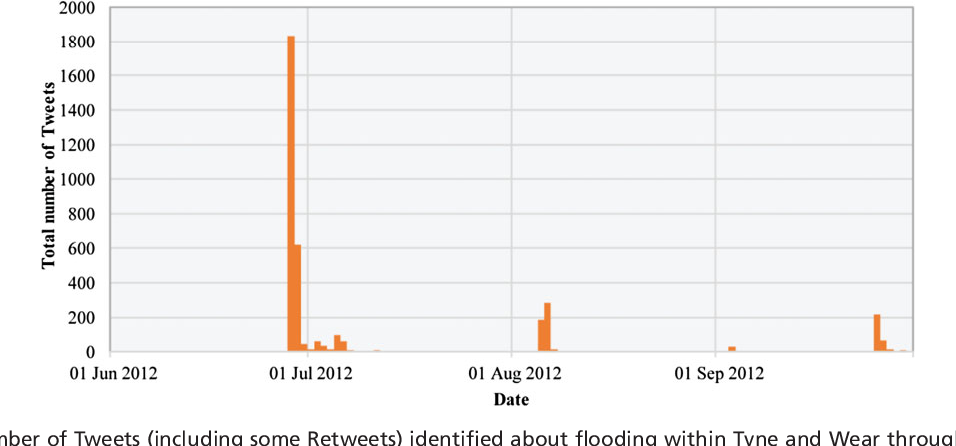
One of the most publicised floods in the UK during 2012 occurred in Tyne and Wear on 28 June 2012, during a month where many parts of the country were battered by short-duration heavy rainfall and thunderstorms over already saturated ground (JBA Risk Management and Met Office, 2012) . A supercell storm hit the city of Newcastle upon Tyne in North East England and the surrounding area at approximately 15:00, only shortly before most people were expecting to leave work. The effects of up to 50 mm of rainfall over 2 h were dramatic: Newcastle Central Station was flooded and the surrounding railway lines flooded or damaged by landslides; underground stations on the area's light rail network were flooded; grade-separated junctions connecting the city to all of the major arterial roads were flooded; and bus services were suspended in some areas. Many people were stranded with no way to get home. More than 300 properties were flooded internally, and damage to highways alone in the Newcastle area was estimated at up to £8 million (Newcastle City Council, 2013) . Rainfall intensity varied greatly, both spatially and temporally across the city, but in some instances, an intensity exceeding 200 mm/h was recorded for a short duration (Environment Agency, 2012) .
Large numbers of people took to social media to voice their concern, share photos, and find the best way home. Retrospective analysis of Twitter on the day shows more than 1800 Tweets, which could be linked to flooding in the area, helpfully identified by the hashtags #toonflood and #newcastleendofdays. Local authorities and emergency responders both started and actively engaged with these hashtags as a way of disseminating information to the public. A further slightly smaller rainfall event occurred on 5 August 2012, in which 40 mm of rainfall fell within 90 min (Newcastle City Council, 2013) . The Twitter activity for these two events is represented in Figure 1 , whereby the timing of the August event on a Sunday is believed to be the main reason for the relatively low number of Tweets.
As a further source of data, Newcastle University asked members of the public to help reconstruct the event through crowd-sourcing, following the success of a similar system following fluvial inundation in nearby Morpeth on 6 September 2008. A simple website allowed photos and text to be uploaded and positioned on a map. The system was publicised through local radio and television, with members of the public encouraged to contribute. About 194 submissions were received, almost all including a photo and the approximate time and location.
The Modelling Framework
The intention of this project is to assess the utility of social networking data and feasibility of real-time high-resolution hydrodynamic modelling, neither of which has previously been explored. Application of two-dimensional hydraulic models to real-time surface water flooding is not currently applied within any operational system in the UK (Ghimire et al., 2013) . No meteorological data are used herein, and the authors are keen to stress that they do not suggest this is the most reliable method for real-time flood inundation modelling. Accordingly, the data stream from Twitter is used to identify when a storm event occurs, invoke hydrodynamic model runs in the correct locations, and subsequently validate the quality of results.
The integrated modelling framework takes data from social media, presently only Twitter, and stores messages that may potentially contain valuable data about flooding. These messages are then processed in order to identify criteria against which model runs can be assessed, thereby finding a suitable hydrodynamic model of the flood event and creating a simulation that closely represents the reported inundation within the city. The results of these simulations can then be fed back to the public and interested parties (e.g. local authorities, emergency responders). Crowd-sourced information, including photos and textual descriptions, provide a basis through which future improvements may be made, and the existing system can be validated. The framework is visually represented in Figure 2 .

The framework consists of a Python-based middleware layer consisting of scripts designed to run as services in the background of a server, mostly remaining idle until a potential flood-causing storm event is identified. Data are stored in a PostgreSQL database with PostGIS extensions.
Social Media Harvesting And Analysis
The framework uses a single stream through the Twitter Streaming API, which receives messages filtered both on keywords and on spatial extent. The API adopts a broad approach to filtering messages, returning anything that matches any of the criteria; a second round of filtering is therefore carried out before messages are committed to the database. Keywords are matched against phrases or multiple criteria at this point, for example: a Tweet containing the word 'flood' with a geotag or bounding box that overlaps with Newcastle; or a Tweet that must match a keyword and a phrase such as 'flood' and 'Newcastle upon Tyne' .
Criteria are regarded as a condition against which a model can be assessed, which herein refers to either depth or velocity of flood water; in practice, this means a minimum, maximum, or range of values that can be satisfied by the model. For example, 'knee-deep' in Figure 3 could be satisfied by a depth ranging from 0.3 to 0.8 m, acknowledging that people have different heights and the term is only an estimate of the depth.

In order to comply with the Twitter API terms of service, Tweets including their geoinformation are committed in their entirety to the database and only held temporarily until they can be analysed, the results of which are anonymous. The temporary storage allows a queue of messages to build pending analysis, which, in some instances, may take a few seconds for each message.
Analysis of messages focuses on two main areas: identification of terms with potential semantic value for a flood event and identification of distinct geographic areas. Terms of semantic value are those that potentially indicate the intensity of rainfall, the occurrence of a major storm, the presence of flooding, depth of flooding, or the velocity of flow. Fifty-five terms were initially identified from inspection of messages during previous flood events; notable examples include 'black skies' ,'thunder' ,'waist deep' , and 'closed' . About 10 217 spatial entities were extracted from a mixture of data sources, including Ordnance Survey vector mapping products, OpenStreetMap, and the Royal Mail postcode address file. All of the data used, except postcode polygons, are freely available in the UK, and no corrections or additions have been made. Accordingly, a similar database could easily be created for any other British urban area. The spatial entities include street names and a large number of building names, allowing messages that refer to flooding in and around markets, parks and shopping centres to be recognised. A hypothetical Tweet has typical terms of interest highlighted in Figure 3 .
Once a critical mass of Tweets referring to storm events or rainfall intensity is identified within the database, a storm event is considered to be in progress and the start time assumed to be the same as the first message. Five messages from different users within a 15-min period is considered to constitute a 'critical mass' herein; however, flood modelling cannot commence until at least one message with a spatial extent and relevant semantic term is identified. A storm event once identified is monitored for a period of 4 h, after which it is likely there will be intervention such as pumping in places of strategic importance, although this period can be reconfigured to be longer. It is assumed that the intense rainfall will last for no longer than an hour for the purposes of simulations with a standardised event. We believe these numbers are appropriate for the short-duration heavy rainfall induced flooding, which typically occurs in summer in the UK; the framework is not suitable for use with groundwater or fluvial inundation events.
Real-Time Flood Modelling
Airborne altimetric LiDAR data are used to represent the topography of the city for hydrodynamic modelling. A digital elevation model was created by the extraction and superposition of walls and buildings from the raw LiDAR data to a post-processed terrain model resulting from the same dataset. Both the raw and the post-processed data are readily and commercially available at low cost, and allow for a model of the city topography free of artefacts, without bridges and trees, but including barriers to flow (e.g. walls). A grid resolution of 2 m was selected to ensure the timely completion of simulations, whilst still clearly representing the majority of smaller flow pathways (i.e. gaps between buildings, alleyways, etc.).
Simulations are constrained to the area shown in Figure 4 , which excludes the more rural areas to the north of the city. Analysis of the topography identified watersheds and allowed the city to be split to form nine different models, all with transmissive boundary conditions but no flow exchanged between them. Only the area under the remit of Newcastle City Council is modelled. The areas covered by each model are also shown in Figure 4 .


The drainage network and associated sewers are not explicitly considered within the model, owing partly to a lack of suitable data regarding the grates and gullies, and more crucially because its effects and quality of operation during an extreme rainfall are likely to be minimal. Nevertheless, in the event of small amounts of rainfall, this would be adequately removed by the drainage network; accordingly, a very simple approximation is implemented, for losses at a rate of 12.5 mm/h in all cells. This is approximately equal to the rainfall for a 2-h duration 1 in 10-year event established using Flood Estimation Handbook (FEH) methodology (Faulkner et al., 1999) ; however, actual performance will vary across the city according to design criteria, season, and related levels of maintenance. This 1 in 10-year flood frequency is consistent with the recommendations for drainage design made in table 2 of BS EN 752:2008, for which sewers should not be expected to surcharge in areas of high risk (i.e. underground railways and underpasses), and close to the 12 mm/h rate determined by the Environment Agency as a typical drainage removal rate, used in their own surface water flood risk mapping projects (Environment Agency, 2013) .

A uniform Manning coefficient across the domain is assumed to be 0.045 s/m 1/3 to partially compensate for street furniture, which is neglected, and the mixture of surfaces, which include long grass and woodland, paving stones, and asphalt. Simulations are for a 2-h period, whilst rainfall is applied uniformly across the domain for 1 h. This allows the rainfall to settle. The shape of the hyetograph for an actual event may, of course, be significant, perhaps concentrating the heaviest rainfall within a 5-min window, but it is not feasible (or in our opinion possible without a large volume of data) to establish this from social media.
Evidence obtained from crowd-sourced images of the June flooding demonstrably confirmed expectations that super-critical flow would be present in parts of the city, such as where flow cascaded down steps, and hydraulic jumps forming on steep roads (e.g. Figure 5 ). Reproduction of these effects requires a shock-capturing model. Efficient and expedient simulation of a 48-km 2 area with almost 12 million cells for real-time flood simulation is beyond the capabilities of most shock-capturing hydraulic models, which are extremely computationally intensive. These numerical models solve the shallow water equations using a finite-volume approach and explicit solutions to the Riemann problem at each cell boundary to create a Godunov-type scheme. Consequently, the explicit models are constrained by the Courant-Friedrichs-Lewy condition (Courant et al., 1967) , which is a function of the largest velocity within the domain and the cell dimensions; accordingly, if the cell resolution of these models is halved, the simulation run-time can be expected to increase by approximately eight times. The 2-m resolution selected herein nonetheless has limitations, such as the stairs shown in Figure 5 , which do not align with the Cartesian grid and are not captured at this resolution; furthermore, this would in effect be considered as a single steep slope within the model rather than individual steps, for which the hydrodynamic behaviour is different. Smith and Liang (2013) demonstrated that a significant speed-up can be achieved for shock-capturing hydrodynamic simulations using modern GPUs designed for use in scientific computing. This work has been extended to allow for first-order simulations (Smith et al., 2015) and domain decomposition across multiple GPU devices. The latter is not used herein as the domain could readily be decomposed to independent models along ridges that do not require data exchanges. The full details of the finite-volume Godunovtype numerical scheme employed can be found in the aforementioned references. Four NVIDIA Tesla M2075 GPUs are used to execute simulations, with a simple database-driven system generating model configurations, monitoring performance, queuing, and dispatching further runs required. Typical simulation run-times are given in Table 1 , although minor variations can be expected for different rainfall intensities and Manning coefficients. Further experiments conducted confirm that using domain decomposition rather than individual models, it is possible to reduce the run-time for all of the areas given in Table 1 within a single model to an hour, although this required considerable computing resources (eight scientific-grade GPUs); with access to further resources, these runtimes could be further reduced. This technique is not applied herein as some parts of the city had very little social media activity during the events, thus only a subset of models was required. Whilst it is possible to simulate the flooding at more than twice real-time speed, even these reduced runtimes would still be a limiting factor in applications for forecasting. This paper therefore focuses on the utility of social media for nowcasting and incident management.

Results from simulations are stored to raster files at 450-s intervals in the simulation. These include the current depth, maximum depth recorded in a cell, and the velocity in the x and y Cartesian directions. These result files are subsequently analysed to determine if a simulation is matching the criteria identified from social media. Each simulation runs only to the next 450-s interval while the event is in progress, and only models where suitable criteria were identified from social media are scheduled for execution; this means that even though multiple model runs are required to find an appropriate match, these can often be achieved in near real-time.
Flood Model Result Analysis
Resultant raster files are analysed for each criterion identified using social media. These criteria stipulate that the depth or velocity in a geographic area should either exceed a value or fall within a defined range. A large number of messages identified referred to a spatial location by describing a nearby landmark or intersection, such as a road being closed at the junction with another, or flooding occurring near to a named shopping centre. Spatial entities are therefore buffered to create an area to extract from the output raster files; the example in Figure 5 shows a leisure complex with a 75-m buffer area around it, and the flooding referred to in numerous Tweets can clearly be seen approximately 50-100 m away. The size of the buffer is configurable. The section of road missing from the buffered area in the figure also shows one of the minor issues with the approach adopted, whereby some spatial features lie close to or on the boundary between the nine different models; in such cases, multiple result files must be consulted.
Each cell within the buffered area is used to generate a histogram for the variable under consideration, an example of which is given in Figure 6 , where a typical shape is exhibited with the majority of cells effectively dry, as shown in the associated histogram Figure 7 . The larger depths are therefore of more interest in determining whether an area is flooded; however, taking the maximum value would potentially identify exceptional cells that are a consequence of deficiencies or artefacts in the terrain model. For the results presented herein, a range of 0.01-5.01 m is used for depth histograms, and 0.01-1.01 m/s for velocity, in both cases with 500 bins. The approach adopted uses the histogram to obtain approximations (which are fairly accurate given the bin size) for the 70th and 95th percentile values, and considers a criterion to be satisfied if there is an overlap between the criterion and the range between these percentiles. The percentile range used is also configurable. In the event that multiple criteria arise from a single Tweet, for example, if the words 'flooded' and 'knee-deep' were found, then only the most stringent criterion will be considered (i.e. knee-deep). The modelling framework is designed to use known or suspected data about flooding in one part of the city to infer areas elsewhere which might be flooded, as a consequence of the same rainfall event. It is therefore not crucial that the framework correctly identifies the amount of rainfall, especially given how spatially varied this could be, but instead identifies a single simulation that best matches social media data. Identification of the best result set is therefore taken to be the lowest amount of rainfall, which satisfies the majority of criteria, where the improvement achieved by adding a further 5 mm of rainfall is less than 5% of the criteria. The gradient of criteria satisfied against total rainfall volume is the key determinant. Whilst ideally the number of criteria satisfied might be expected to eventually begin to decrease with excessive amounts of rainfall, this is often not the case, as the majority of criteria only stipulate a minimum depth (i.e. knowing somewhere has been closed or flooded, results in a criteria based only on minimum depth).


Results And Discussion
The integrated modelling framework was tested using retrospective data collected from Twitter following the two major flood events in Newcastle upon Tyne during 2012, the smaller of the two occurring on August 5 and the larger on June 28. For the two events, respectively, a total of 186 and 1834 Tweets were collected; however, only 168 and 1243 of these were within 4 h of the framework identifying a potential event in progress.
The event on June 28 is believed to have spread 50 mm of rainfall over some parts of the city, with peak rainfall rates approaching 200 mm/h. Analysis of UK Met Office NIMROD rainfall radar for the event suggests that the average across the city was approximately 46 mm. The August 5 event by contrast is thought to have totalled 30-40 mm. The framework makes no accommodation for spatial variations in rainfall rate, the varying intensity, and uses only a simple assumption for drainage losses. For simulations hereafter, the 10-mm and 80-mm events were completed in advance, providing a starting point for the framework to begin new model runs.
Geolocating Tweets And Identifying Criteria To Assess Models Against
From the aforementioned Tweets with timestamps in the first 4 h of each event, semantically relevant terms and spatial location names were matched. Those with both present, where the semantic term infers implications for either a depth or velocity, are considered to be useful. Only 43 such Tweets could be identified for June 28 and 13 for August 5, shown in Figure 8 . On June 28, the first Tweet about the weather was made at 15:57, whilst the first Tweet with enough detail to create a model criterion was at 16:12. On August 5, the first tweet was at 13:44, but a whole hour later before a Tweet containing enough data for a model criterion, which is a prohibitively long time in terms of incident management.

Manual inspection of Tweets will clearly identify further useful information; however, the framework is intended to be completely automated; consequently, some instances where typing errors were made or colloquial terms used to refer to areas resulted in no match. Implementation of the Levenshtein algorithm, Soundex, or vernacular geographies for geocoding could assist and may be explored in the future. Geotagged Tweets identified during both events were not found to be of practical use; in some instances, the geotag identified a location different to where flooding was occurring, often in the case of Retweets.
The majority of the locations matched were major roads in the city, as a consequence of these roads both being strategic routes affecting many people, and also the gradeseparated junctions collecting water and quickly flooding, as shown in Figure 9 . Sometimes buildings were identified as flooding, which while useful information, the hydrodynamic model cannot reproduce flooding within the building as they are assumed to be solid. The models are likely to correctly reproduce internal flooding entering from the neighbouring streets through the depths in the buffered cells around a feature but could not identify flooding as a result of leaking roofs.

Correlation Of Models Against Criteria From Social Media And Known Data
Despite the low number of comparison criteria identified for the smaller August 5 event, a good match is easily identified, with the number of criteria satisfied reaching a plateau at approximately 30 mm of rainfall, which is close to the actual amount, as shown in Figure 10 . No crowd-sourcing of photographic and textual data about the August event was undertaken, so there are little data to use for further validation.

A greater volume of validation data is available for June 28. The change in criteria satisfied becomes less than 5% at 45 mm of rainfall; however, as can be seen in Figure 11 , this is marginal, with the next increase (from 50 to 55 mm) seen to increase by slightly over 5%. This is not altogether surprising: the framework makes no allowance for the temporally varying intensity of rainfall, and it is known that on June 28, the heaviest rainfall was at the start of the event. Consequently, flood depths for areas that have small catchment areas, and flood first, were underestimated at least to begin with. The spatial variation in rainfall intensity is also difficult to assess, with only a handful of reliable rain gauges in the city and inaccuracies in rainfall radar (Wood et al., 2000) .

Simulation results for 45-60 mm of rainfall all agree well with areas known to have flooded. A small area of the city is shown in Figure 12 , with areas known to have flooded highlighted. All of the circled areas except Debdon Gardens were identified as having flooded from Tweets, which in many cases included photos. The depths are a good approximate match against these photos. In the case of Debdon Gardens, crowd-sourced data from the public informed us that a small area of the road had flooded, with the water travelling through back gardens and collecting near the junction with Danby Gardens. Despite no social media data indicating the presence of flooding here, the simulation clearly shows a small area of flooding, with final depth approximately 0.25 m. This clearly suggests that the framework is able to use areas with known flooding to automatically identify other areas likely to have flooded, in some cases at the level of individual properties.

Conclusions
We have presented a framework for collecting and processing data about flooding in real-time during a storm event, which is used directly to instigate and evaluate computer simulations and extrapolate from the known extent to other areas likely to have flooded. The performance of the simulations, when compared to data obtained through crowd-sourcing and from elsewhere, demonstrates that whilst the volume of rainfall cannot be determined exactly owing to other unknowns (e.g. the efficacy of the drainage network), the extent and depth of flooding is reproduced in most cases, even with small numbers of model criteria identified in social media. It is important to note that only two events are considered herein, and there is no guarantee of reproducibility, especially for areas with fewer social media users. With respect to the utility of social media in flood risk management, the evidence from Newcastle upon Tyne suggests that 1. whilst there are data within Tweets regarding the location of flooding, indications of depth are often absent, and the associated timestamp may not be representative of the observation; 2. initial activity on social media tends to focus on the intensity of the weather, whilst useful activity detailing areas explicitly affected can sometimes come much later; 3. a considerable number of useful data identified were distributed by local authorities, emergency responders, and other public sector organisations, based upon reports from the public made by other means and CCTV cameras; and 4. photographs have value for retrospective analysis of an event, but social media sites generally strip embedded data including the date and time of capture, hence other means of collecting photographs which preserve this information may be required. Potential avenues for improving the framework have been identified, primarily focusing on improved interpretation of Tweets and matching ambiguous terms. The framework is clearly better suited to incident management applications than forecasting, but provides a basis through which the public can be informed of the best routes for travelling, and local authorities can identify the areas requiring the most immediate attention.